LabDeck is a local-first dashboard built to give real-time visibility into distributed homelab nodes. It aggregates Prometheus metrics, service health, and infrastructure status into a clean visual HUD that works offline and prioritizes operational clarity over decorative visual noise.
LabDeck
Real-time homelab HUD for distributed node visibility, metrics, and operational status.
Overview
Problem
With homelab nodes scattered across multiple machines, tracking system health, service status, and resource utilization became fragmented. Local dashboards required network access, and external monitoring tools added latency and complexity.
Architecture
- Data Layer
- Prometheus
- service checks
- node metrics
- Aggregation Layer
- local cache
- status normalization
- health scoring
- Presentation Layer
- Tauri desktop app
- HUD layout
- visual status
- Storage Layer
- SQLite
- local metrics cache
- historical snapshots
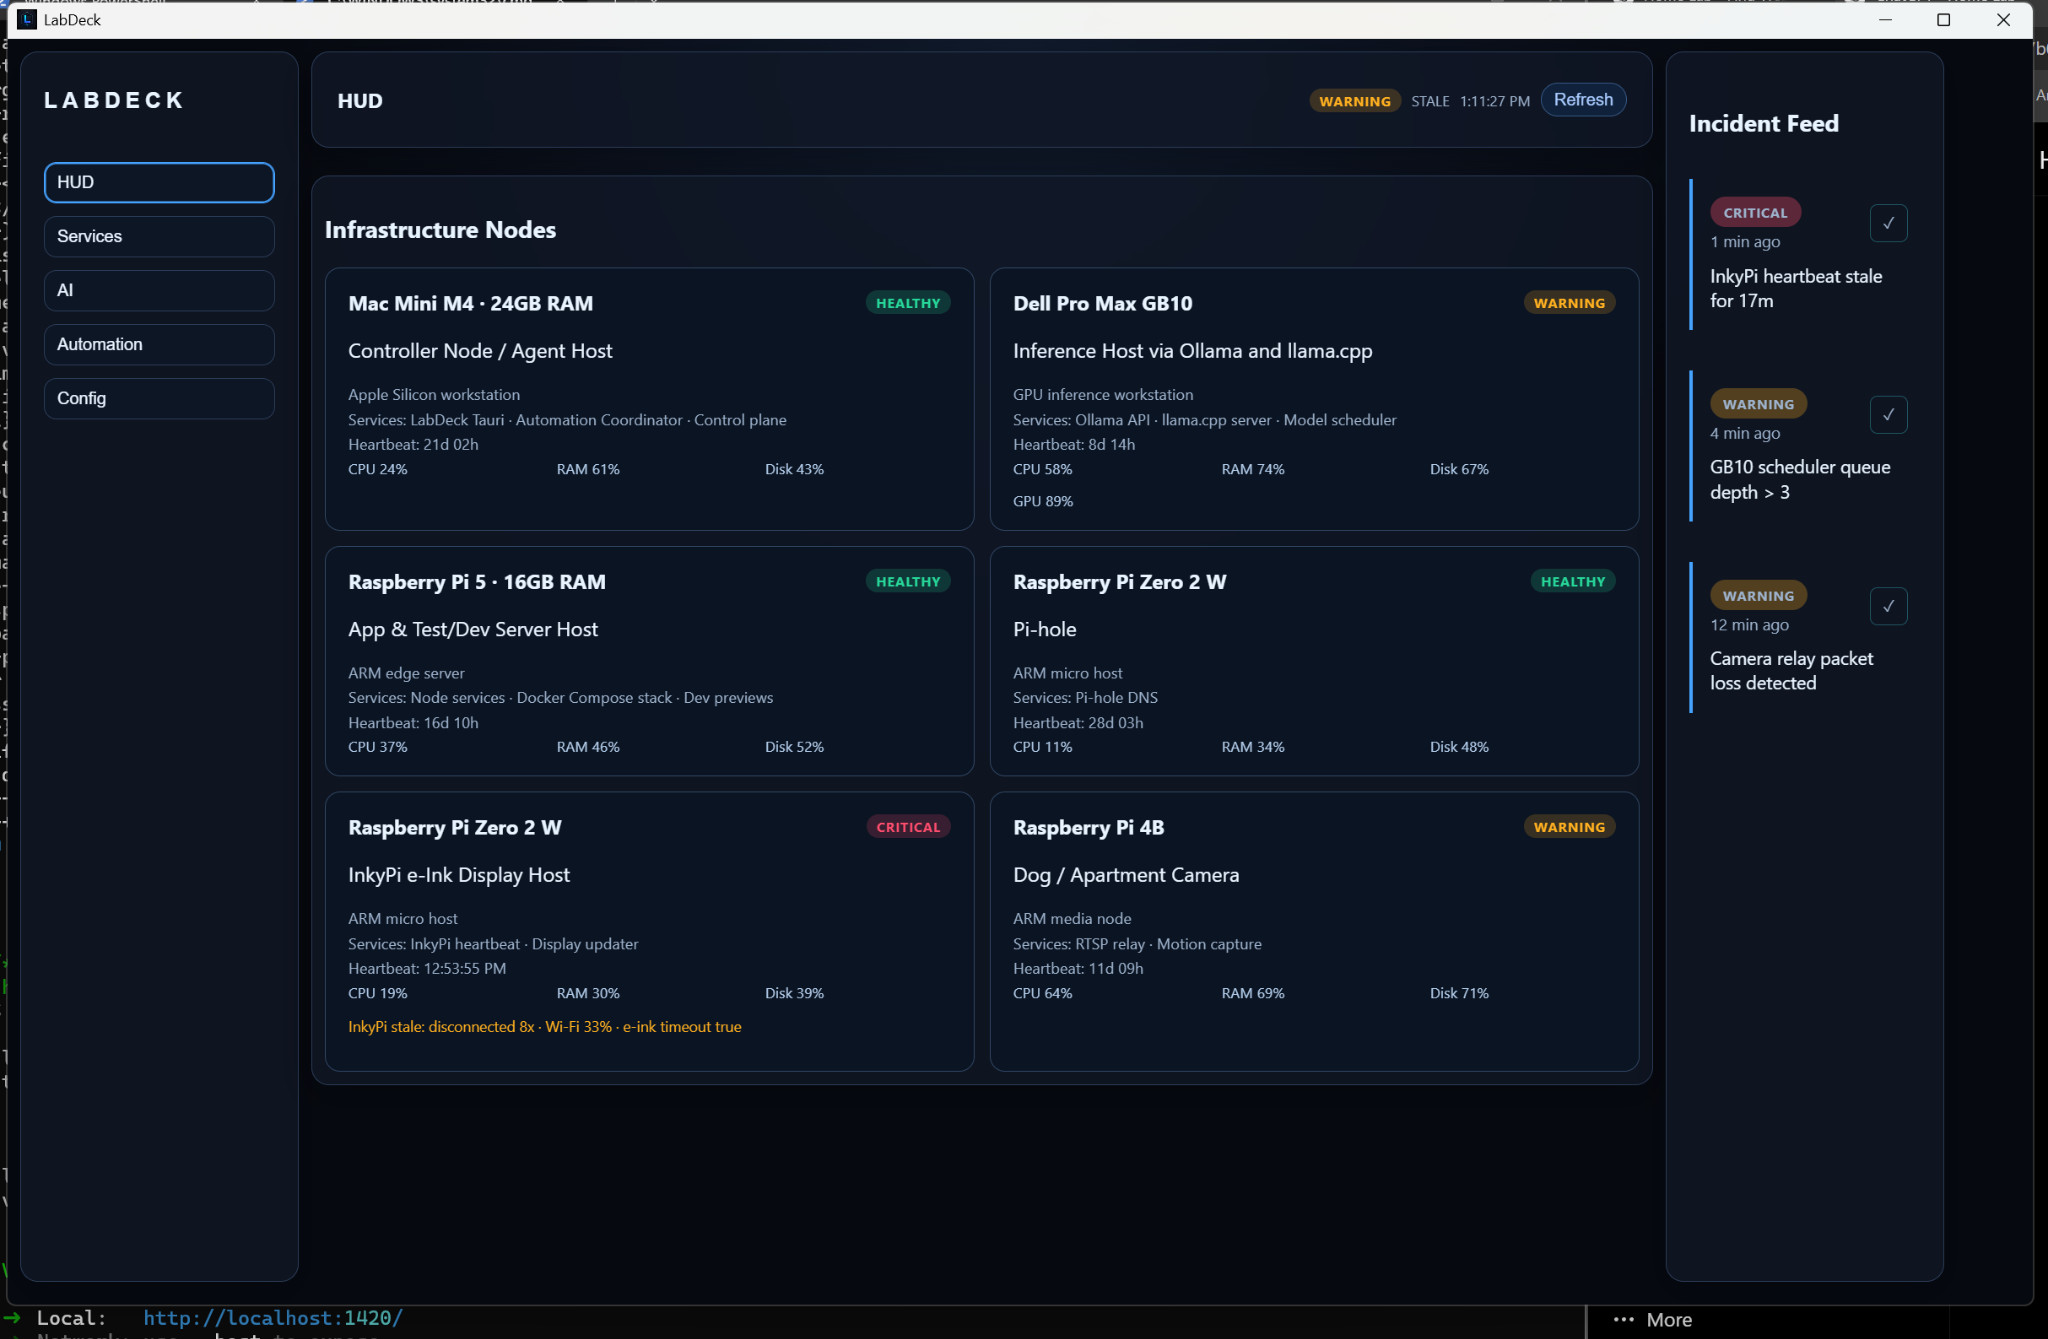
LabDeck architecture showing data collection from distributed nodes into a local HUD.
Technology Stack
Technologies
Tauri
Rust
TypeScript
SQLite
Prometheus
local metrics
Capabilities
- Real-time metrics aggregation
- Service health status display
- Visual status indicators
- Offline-first local caching
- Node-level resource monitoring
- Actionable alerting and status
Implementation
LabDeck is implemented as a Tauri desktop application with a Rust backend and TypeScript frontend. It fetches metrics from local and remote Prometheus endpoints, caches data locally, and renders a visual HUD with color-coded status indicators and quick-action buttons.
Outcome
LabDeck provides instant visual feedback on homelab health with a glance, reducing time to identify and respond to infrastructure issues.
What's Next
- Add service-specific dashboards
- Historical trend visualization
- Custom alert rules
- Mobile companion app